*** Proof of Product ***

Exploring the Essential Features of “The Volume Traders 2.0 – Sebastian “
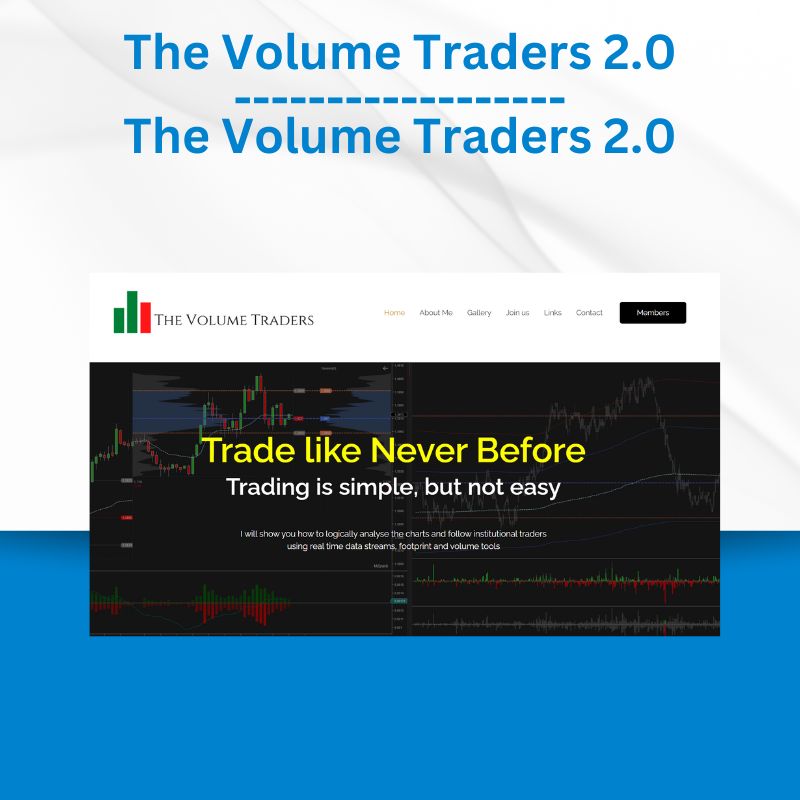
The Volume Traders 2.0 – Trade Like Never Before
Trading is simple, but not easy.
Why Choose Me
I am a full-time trader, actively trading a live account, and I openly share my statements and withdrawals for transparent insight.
At TVT, we exclusively trade GBPUSD, building a deep understanding through two years of backtesting and pattern spotting to refine our strategy and create a golden setup scenario for execution.
Results – TVT has nothing to hide; we openly share our statements and withdrawals on IG and Discord.
Entries – If you struggle with entries, we teach you how to find precise entries with confidence and logic.
GBPUSD – Save yourself the stress of analyzing multiple pairs—MASTER ONE.
Mentoring, Guidance, Support – The TVT Discord community includes mentors and educators ready to answer questions and help you refine your understanding of the course teachings.
What’s the Difference Between TICK Volume and REAL Volume?
- Tick Volume is the volume you see in your MT4/MT5 terminal. It represents the sum of price changes within a specific candle. However, it doesn’t include the size traded at that price. Tick volume can vary significantly between different brokers and may not reflect actual volume accurately.
- Real trading volume provides comprehensive trading data, including the direction and size of current trades being placed.
How Do We Obtain Real Volume?
We source real volume data from the Futures market, specifically 6B contracts for GBPUSD.
What Are Footprint Charts?
Footprint charts are a type of candlestick chart that goes beyond price, providing additional information on trade volume and order flow. These charts reveal the inner workings of market activity as candles are formed. See the example on the left for a visual representation.
Please see the full list of alternative group-buy courses available here: https://lunacourse.com/shop/


