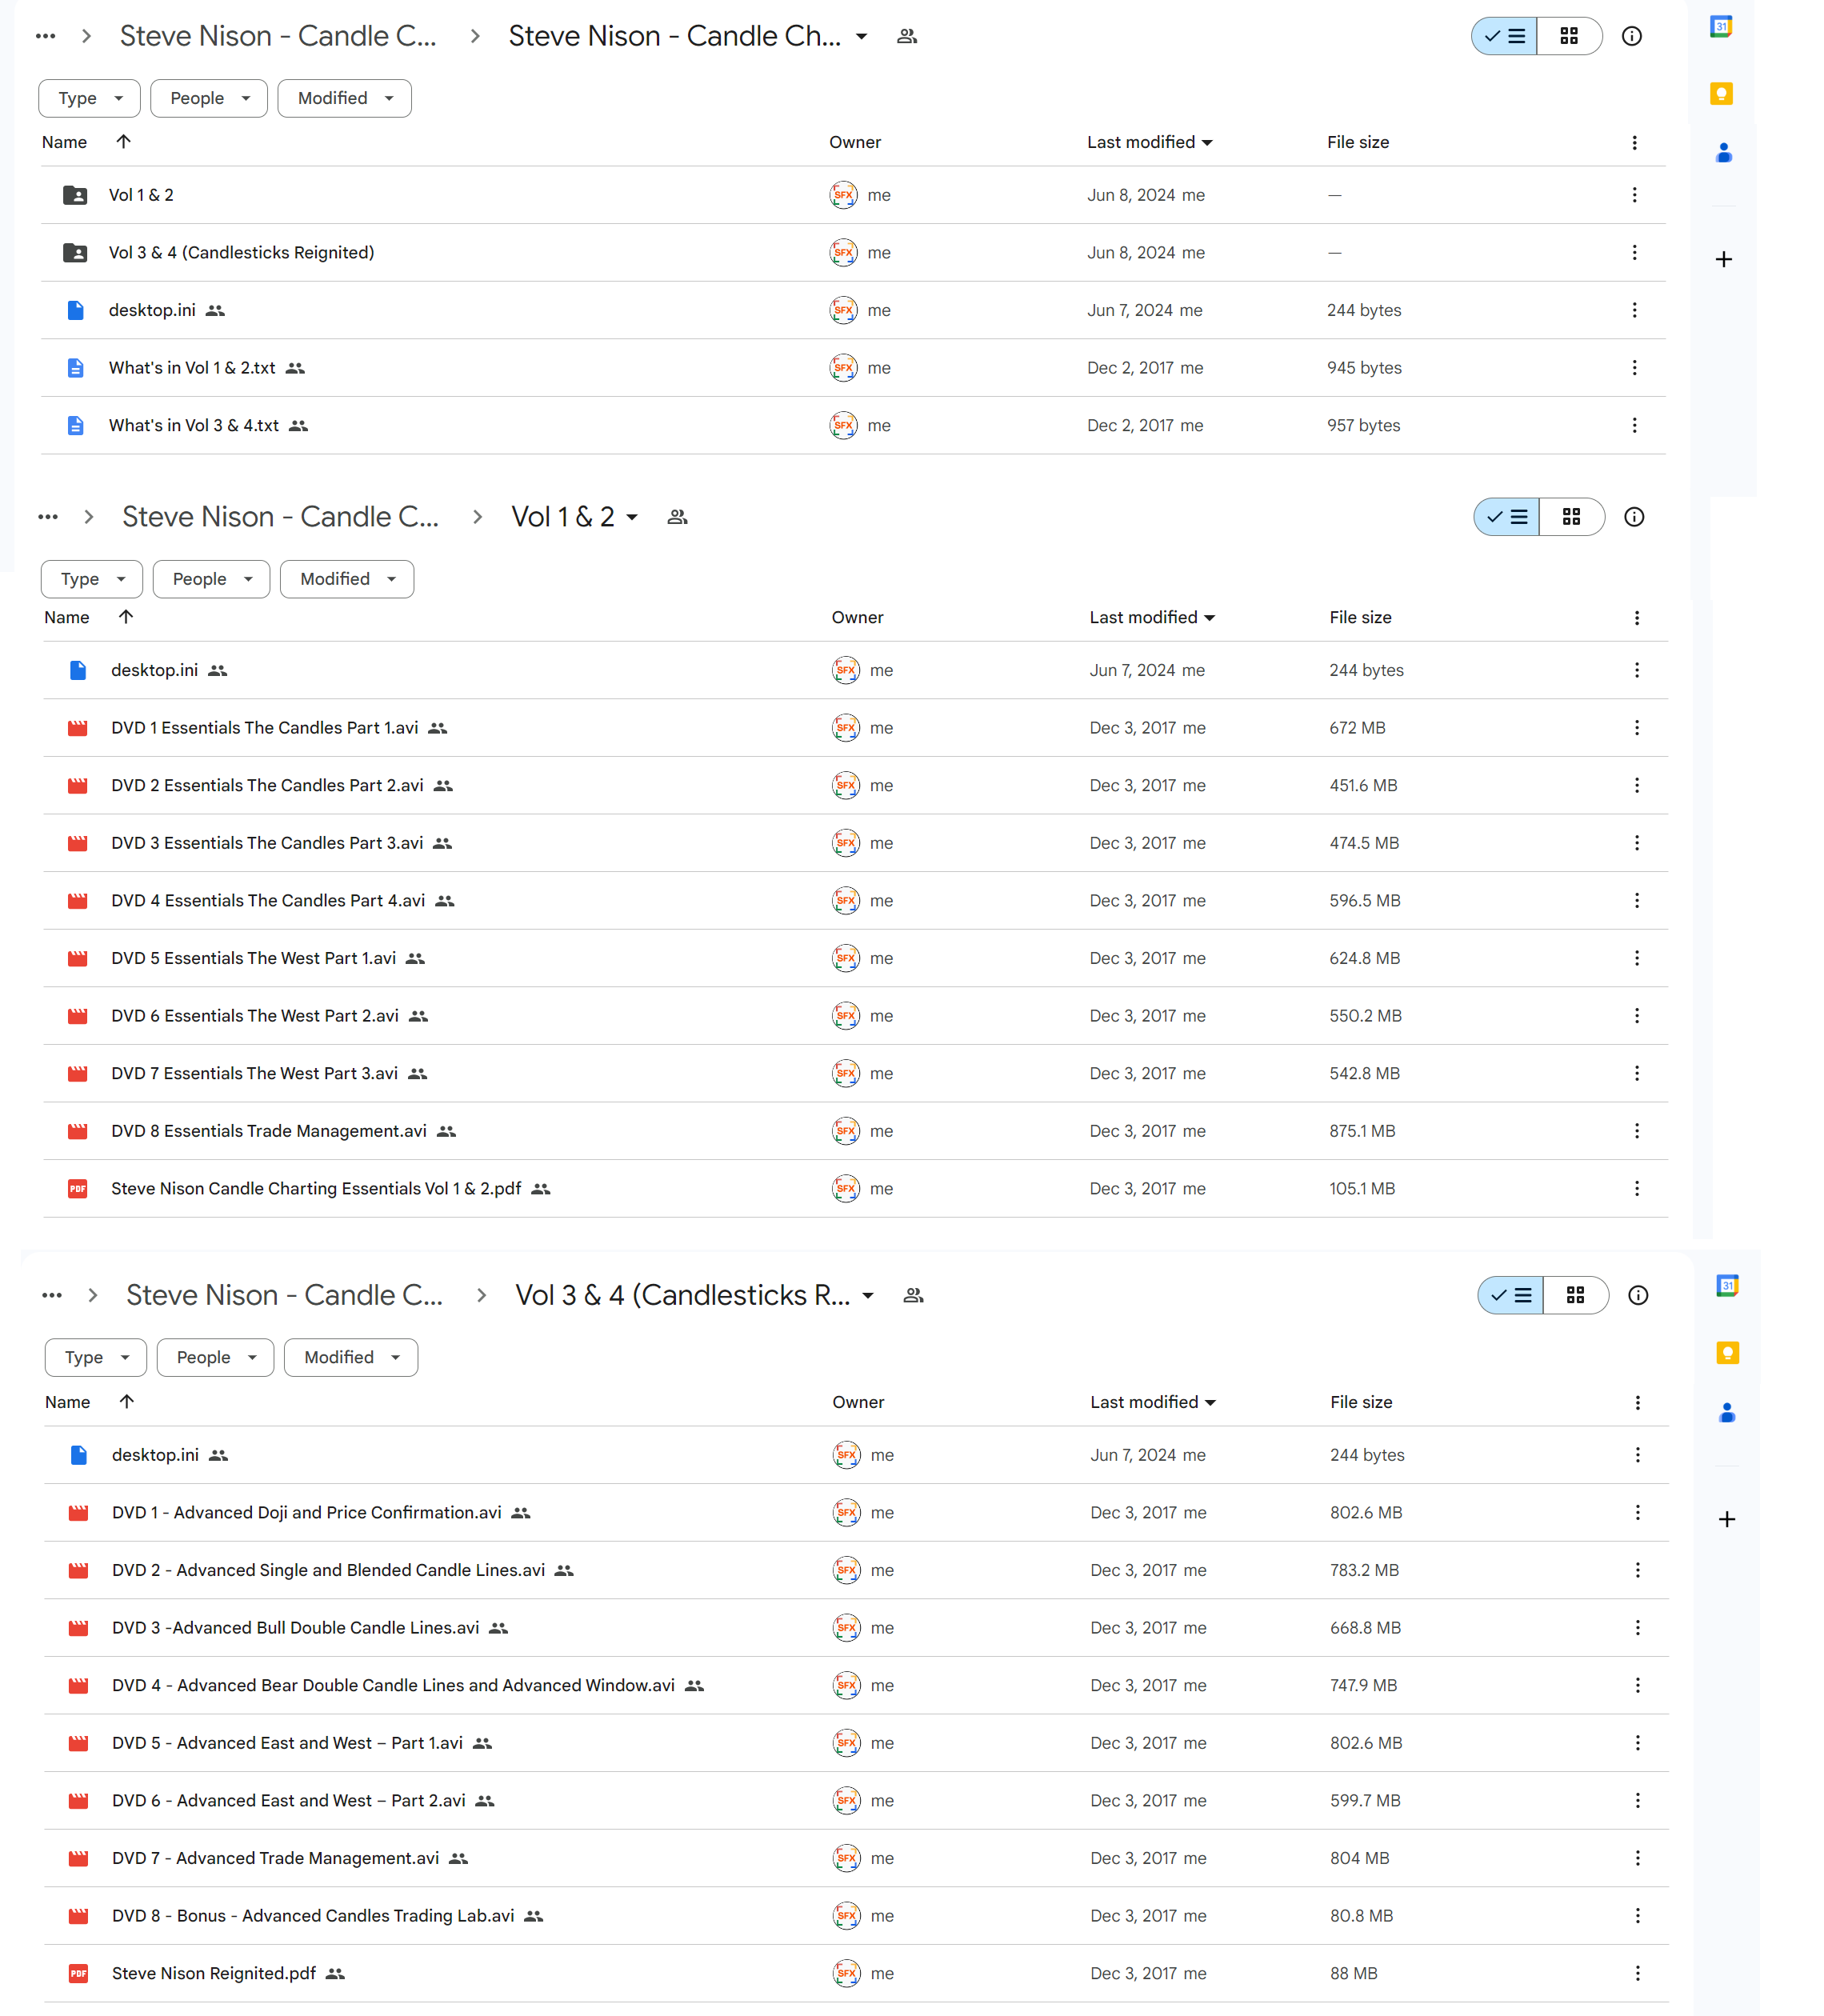
*** Proof of Product ***

Exploring the Essential Features of “Steve Nison – Candlecharts”
Candlestick charting, a key technique in technical analysis, offers traders a nuanced view of market psychology and price action. This method, developed in Japan more than a century before Western trading techniques like bar and point-and-figure charts, was popularized in the West by Steve Nison in the 1990s. Understanding candlestick charting provides invaluable insights into market sentiment and helps in predicting market trends and reversals.
Course Structure and Content
1. Basic Concepts
- Candlestick Components: Learn about the body, wick (shadow), and color of candlesticks, which are crucial for interpreting market movements.
- Bullish vs. Bearish Candlesticks: Distinguish between bullish (rising) and bearish (falling) candlesticks to gauge market direction.
2. Key Candlestick Patterns
- Single Candlestick Patterns:
- Doji: Signifies market indecision, indicating a potential shift in momentum.
- Hammer and Hanging Man: These patterns signal potential reversals, useful for predicting changes in trend direction.
- Dual Candlestick Patterns:
- Engulfing Patterns: Powerful indicators of market direction changes, where a smaller candle is engulfed by a larger one.
- Harami Patterns: Suggest potential trend continuation or reversal, characterized by a small candle contained within the body of a larger candle.
- Triple Candlestick Patterns:
- Morning and Evening Stars: Strong reversal patterns that mark the beginning of new trends.
- Three Black Crows and Three White Soldiers: Indicators of trend strength and potential continuation, reflecting sustained market moves.
3. Technical Analysis Integration
- Support and Resistance Levels: Use candlestick patterns to identify and confirm key support and resistance areas. Integrate patterns with other technical indicators for robust analysis.
- Trend Analysis: Recognize and confirm trend reversals with candlestick signals. Apply patterns to detect whether trends are continuing or reversing.
- Volume Analysis: Validate candlestick patterns with volume data, understanding its role in confirming price movements.
4. Practical Application and Strategies
- Trade Setups: Identify high-probability trade setups using candlestick patterns. Combine with other strategies for enhanced accuracy.
- Risk Management: Set stop-loss and take-profit levels based on candlestick signals. Manage risk through thoughtful position sizing and strategic entry and exit points.
5. Case Studies and Real-World Examples
- Historical Market Data: Analyze past market data to see how candlestick patterns perform in different scenarios.
- Trade Analysis: Learn from both successful and unsuccessful trades to refine your approach and improve future performance.
6. Advanced Techniques and Insights
- Multiple Time Frame Analysis: Use candlestick patterns across various time frames for a comprehensive market view. Align short-term signals with long-term trends for better decision-making.
- Pattern Reliability: Understand the success rates of different patterns and recognize false signals to avoid common pitfalls.
- Integration with Modern Tools: Leverage modern charting software for more accurate and efficient pattern recognition.
Instructor’s Expertise
- Steve Nison’s Background: A pioneer in candlestick charting and renowned author, Steve Nison brings extensive experience and a talent for simplifying complex concepts.
- Teaching Approach: Nison’s course emphasizes practical application and real-world scenarios, providing step-by-step guidance to develop a trader’s intuition and market understanding.
Additional Resources
- Books and Publications: Further reading recommendations to deepen your knowledge.
- Online Tools and Communities: Membership to forums, webinars, and live sessions with Steve Nison for ongoing support.
- Supplementary Materials: Access to cheat sheets, quick reference guides, and video tutorials for continued learning and practice.
Conclusion
Steve Nison’s Candlecharts course offers a comprehensive exploration of candlestick charting, suitable for traders of all levels. By mastering candlestick patterns and integrating them into your trading strategy, you can gain a deeper understanding of market dynamics and enhance your ability to predict price movements. This course equips you with the tools and knowledge necessary to succeed in trading and achieve greater success in the markets.
Please see the full list of alternative group-buy courses available here: https://lunacourse.com/shop/


