

*** Proof of Product ***
Exploring the Essential Features of “Jason Hoppe – Data Visualization Using the Charts & Graphs Tools in Illustrator”
- 6 Video lessons in HD
- 1h 20m of class content
LESSONS
1. Create A Custom Pie Chart
2. Custom 3D Pie Charts
3. Create Custom Bar Charts
4. Area Graph With Custom Dotted Line
5. Add A Drop Shadow For 3D Charts
6. Format Infographics For Print And Web
CLASS DESCRIPTION
Charts And Graphs Made Easy
Create data-driven infographics with Adobe® Illustrator’s easy to use built-in tools. In this beginner-friendly class Adobe certified instructor Jason Hoppe will show you how to use Illustrator’s chart features to create compelling visuals faster and more effectively than you ever thought possible.
Topics include:
- Starting with existing data entered manually or imported from a spreadsheet
- Radial, pie, line charts and graphs
- Simple and easy-to-apply tips for fonts, colors and graphics
- Dos and don’ts of data visualization
- Breaking apart chart data and format content into cutting-edge graphics
- Formatting infographics for print and web
Software Used: Adobe Illustrator CC 2017
JASON HOPPE
An Adobe® Certified Expert and Adobe® Certified Instructor, Jason Hoppe has accrued more than 17 years’ experience in high-end production training, photo retouching, color correction, and creative workflow management. In fact, Jason has been performing high-end electronic production since the industry’s inception. Also during this time, Jason has taught prepress and electronic design to hundreds of Seattle-based creative professionals and aspiring designers in a variety of settings, including one-on-one tutoring, classroom instruction, live webcasting, and large group training. He currently teaches the Adobe® Creative Suite at The School of Visual Concepts, Luminous Works and Seattle Central College and was the founding Instructor at CreativeLive.
Please see the full list of alternative group-buy courses available here: https://lunacourse.com/shop/


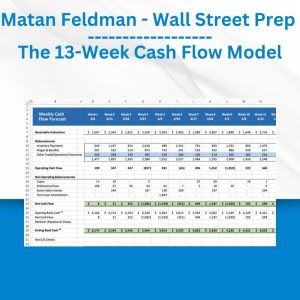 Matan Feldman - The 13-Week Cash Flow Modeling - Wall Street Prep