
*** Proof of Product ***
Exploring the Essential Features of “Scenario & Sensitivity Analysis in Excel – Tim Vipond – CFI Education”
Financial professionals must understand how to create different scenarios, as well as the ability to sensitize key metrics for less-certain outcomes.
- Properly structuring a model to run different scenarios
- Analyze key metrics using data tables
- Making the outputs presentation-ready
Overview
Recommended Prep Courses
These preparatory courses are optional, but we recommend you to complete the stated prep course(s) or possess the equivalent knowledge prior to enrolling in this course:
- Introduction to 3-Statement Modeling
- Introduction to Business Valuation
Scenario and sensitivity analysis course overview
This advanced financial modeling course will teach you how to perform Excel sensitivity analysis with a focus on practical applications for professionals working in investment banking, equity research, financial planning & analysis (FP&A), and finance functions. The tutorial goes step by step through all the formulas and functions required to perform the analysis in Excel from scratch.
What will I learn about Excel sensitivity analysis?
This course is highly condensed and students will learn a lot in a short time. The agenda for this tutorial is:
- Introduction, scenario vs sensitivity
- Why perform sensitivity analysis? – how to enhance financial modeling and analysis
- Scenario analysis in Excel – structure, setup and CHOOSE function
- Sensitivity model integration – direct and Indirect methods, data tables
- Analyzing results – sorting and organizing the data
- Gravity sort table – using LARGE and SMALL functions in Excel to auto-sort
- Tornado charts – a visual representation of the results
- Presenting results – making the output presentation ready
By the end of this course, you will have a thorough grasp of how to build a robust sensitivity analysis system into your Excel financial model. Form and function are both critical to ensuring you can handle quick changes and information requests when you’re working on a live transaction.
Why take this Excel sensitivity analysis course?
This course is designed based on years of practical experience performing financial model sensitivity analysis. We use real-life templates and examples to teach you how to perform it step-by-step the way industry veterans do. Unlike other courses, ours uses both the direct and direct methods of measuring financial sensitivity – and applies those methods to both operating and financial stresses. Our sensitivity analysis Excel template can be downloaded at the end of the course and used as an example in your own work.
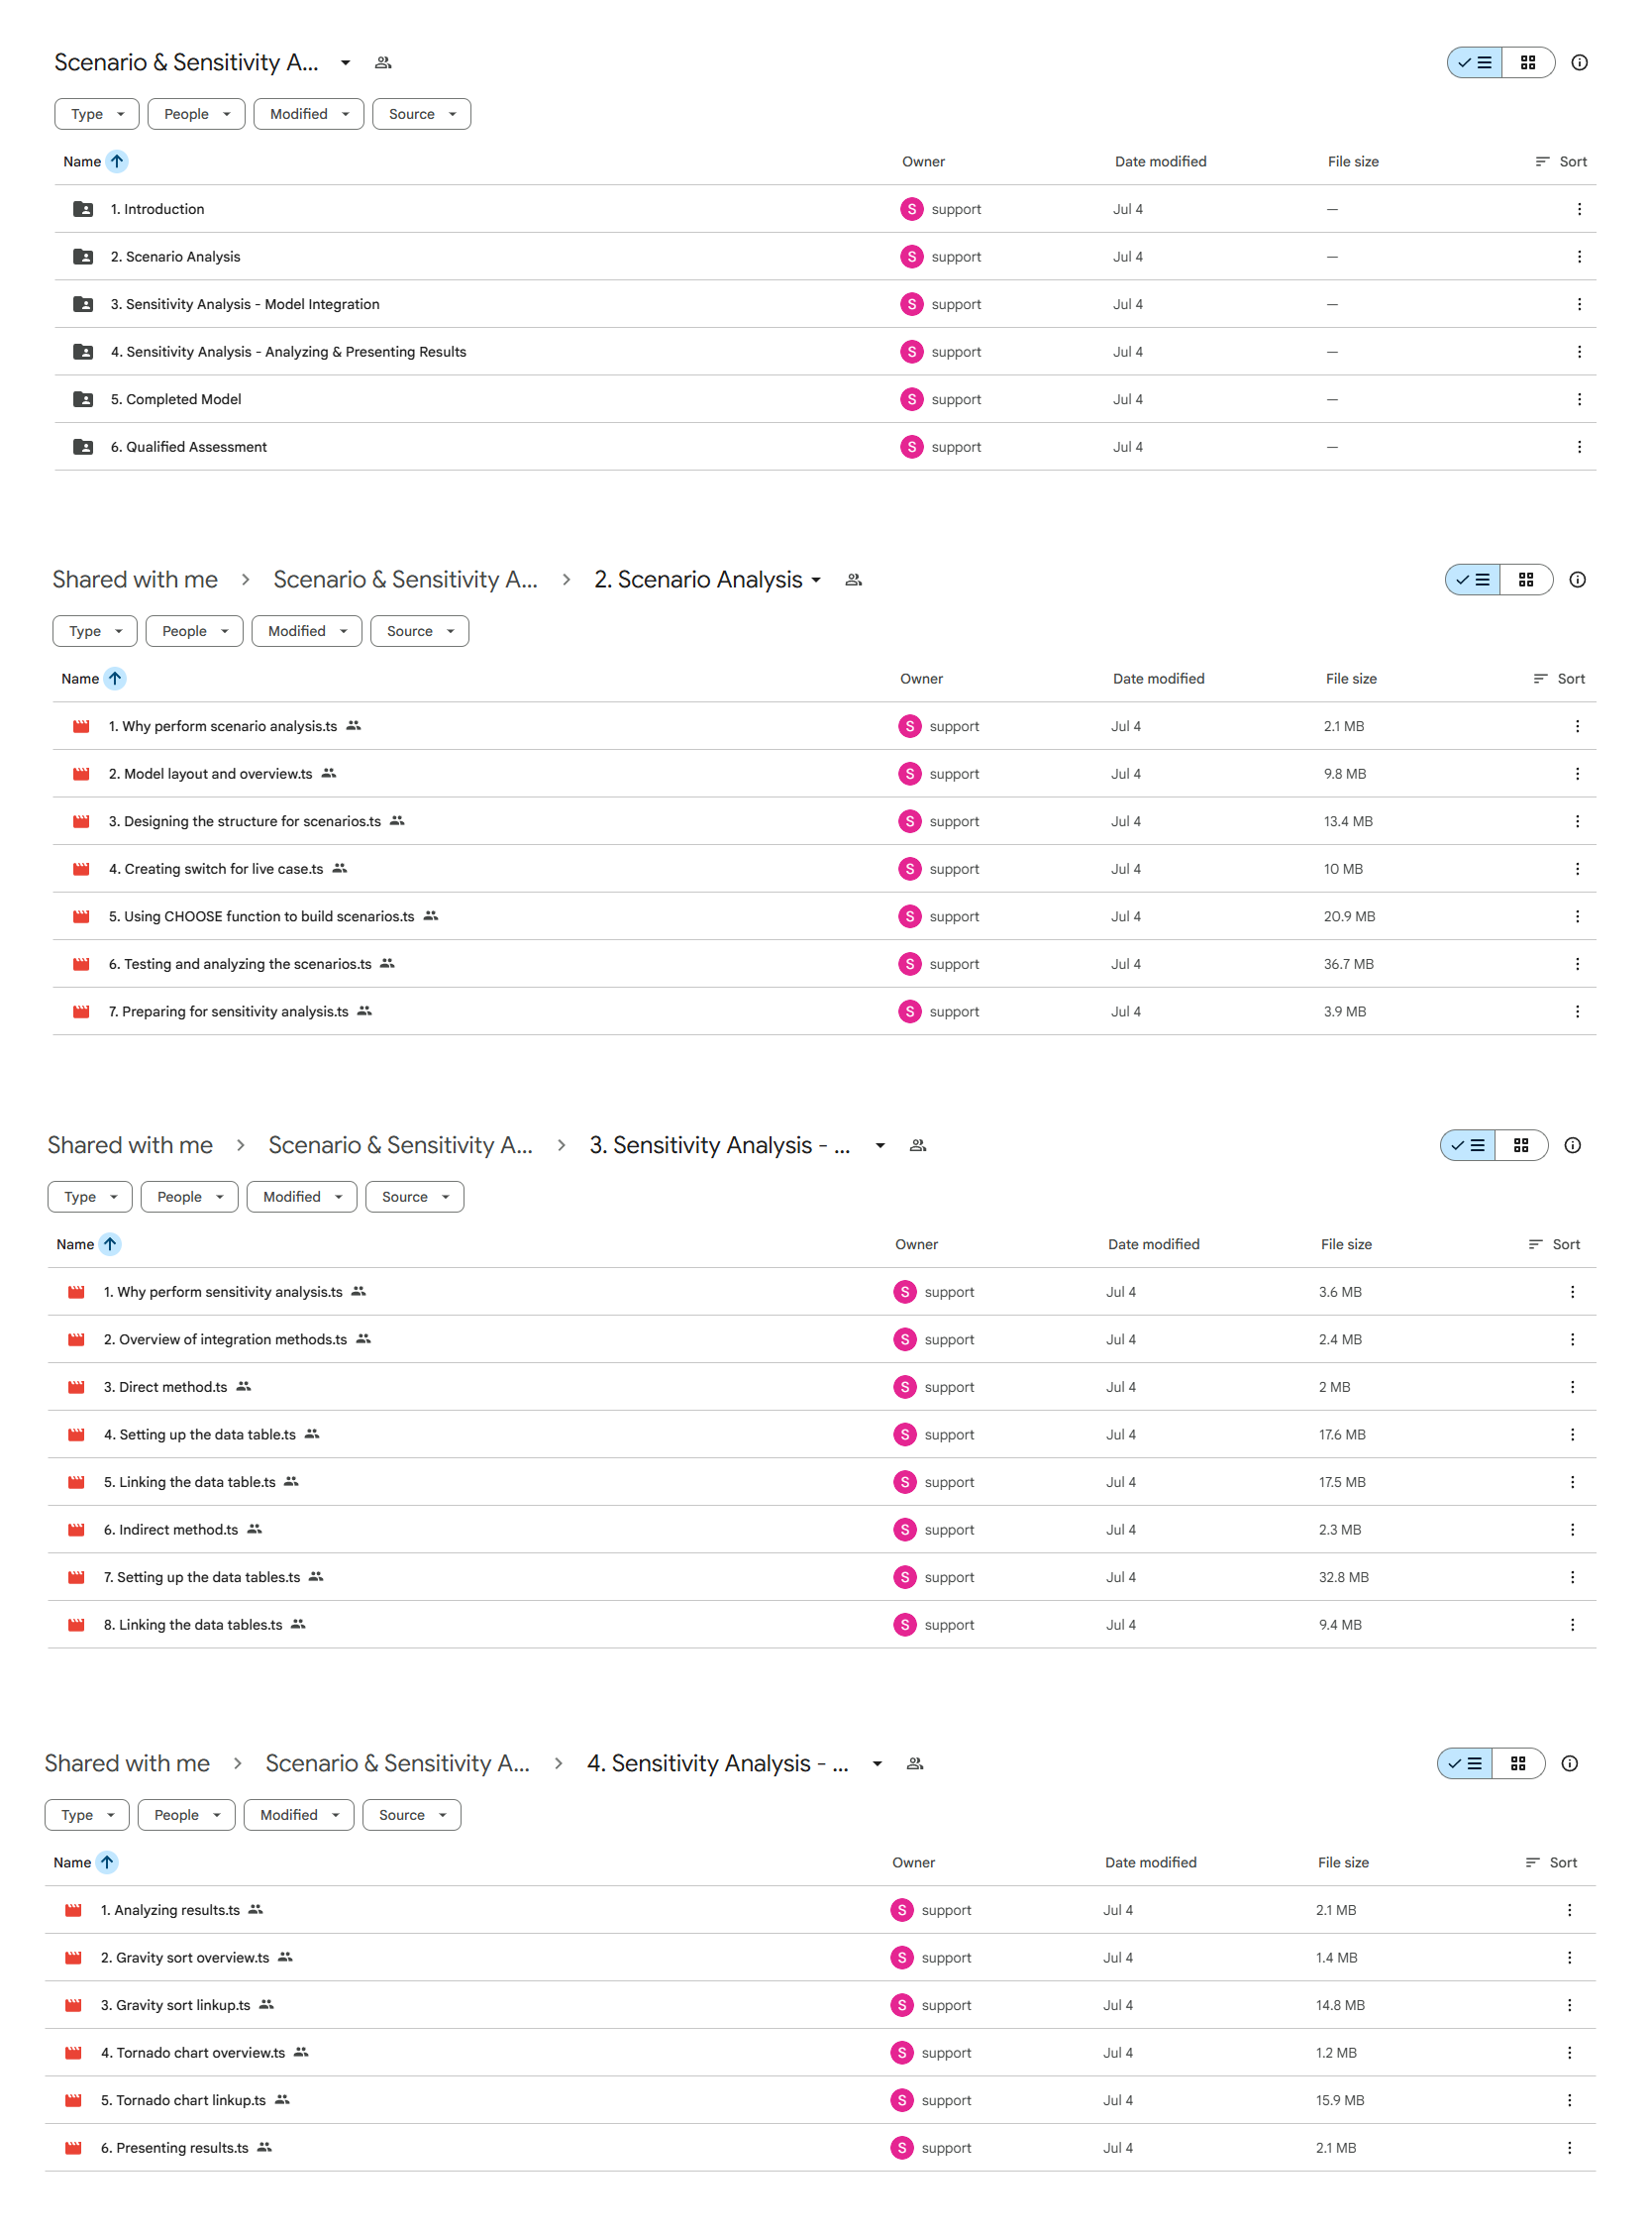
What you’ll learn
Introduction
Course introduction
Learning objectives
Downloadable files
Scenario analysis vs sensitivity analysis
Interactive exercise 1
Scenario Analysis
Why perform scenario analysis?
Model layout and overview
Designing the structure for scenarios
Creating switch for live case
Using CHOOSE function to build scenarios
Testing and analyzing the scenarios
Preparing for sensitivity analysis
Interactive exercise 2
Sensitivity Analysis – Model Integration
Why perform sensitivity analysis?
Overview of integration methods
Direct method
Setting up the data table
Linking the data table
Indirect method
Setting up the data tables
Linking the data tables
Interactive exercise 3
Sensitivity Analysis – Analyzing & Presenting Results
Analyzing results
Gravity sort overview
Gravity sort linkup
Tornado chart overview
Tornado chart linkup
Presenting results
Interactive exercise 4
Completed Model
Sensitivity analysis wrap up
Download completed sensitivity model
Summary
Qualified Assessment
Qualified assessment
Please see the full list of alternative group-buy courses available here: https://lunacourse.com/shop/